Geos all over the world, for many years have displayed subsurface data to other geos as well as to non-technical stakeholders. As I’m sure many of you will know, this comes with its challenges. From other geo’s not being familiar with the data to engineers or business managers outright not understanding what they are looking at – a communication barrier is often met, and this can, stall projects and progress.
This is where the power of clear, concise, visuals can bridge this gap and streamline communication.
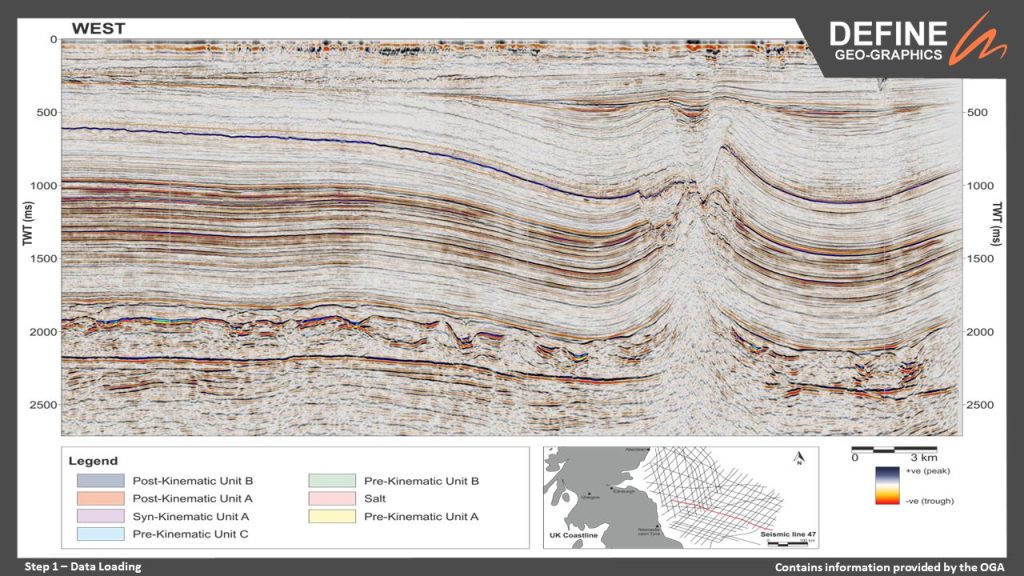
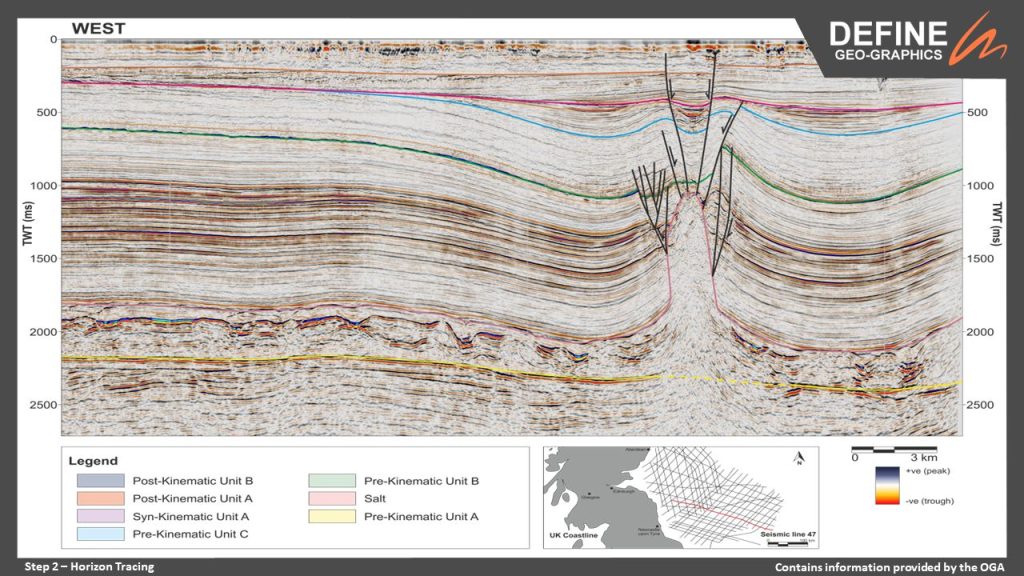
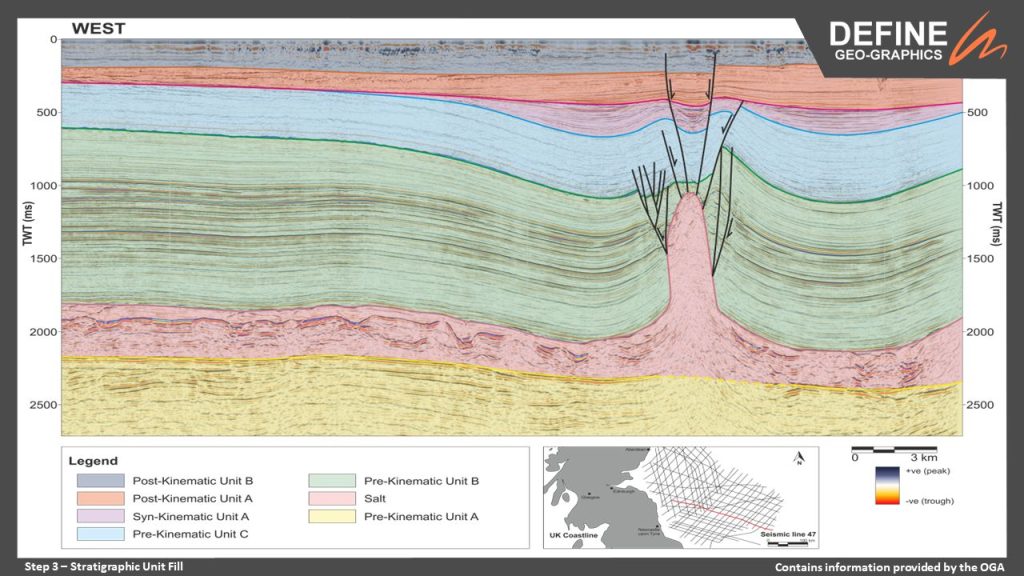
The image below shows our interpretation of a seismic line from the Mid North Sea High. Tune in next week to see how we have transformed this seismic data into a play cross section.
Seismic data made available courtesy of DGB via Terranubis and contains information from the OGA.